Monday, November 9, 2009
Wednesday, October 21, 2009
B :: Stage 4 - Changing occupancy rate of the accommodations in Auckland CBD
B :: Stage 1 - Demographics Overview
A :: Stage 4 - Collecting Data (occupancy rate)
A :: Stage 3 - Locations
Hotels and University Accommodations in Auckland Central area
Locations - Apartments
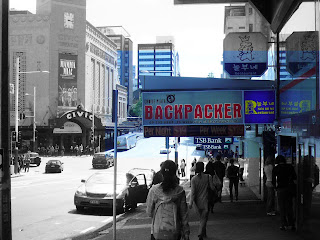
Locations - Hostels & Backpackers
Locations - Hotels
Locations - University Accommodations
LOCATIONS
A :: Stage 2 - Collecting Web Resources
A :: Stage 1 - Collecting Data
-Collecting Data about Auckland Accommodation
CONCLUSION: There are not many resources and information about Demographics and Accommodation in Auckland CBD
Wednesday, August 19, 2009
EXAMPLE-2
For me, the biggest challenge is to visualize the data and represent the mapping project.
I have found some stunning examples of data visualization from the website http://webdesignledger.com/inspiration/15-stunning-examples-of-data-visualization
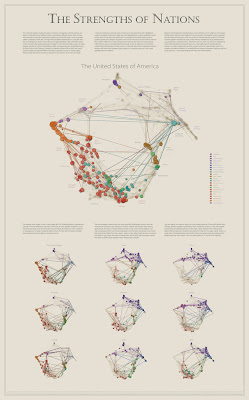
The Strengths of Nations
Madrid. Citymurmur
One Week of the Guardian
Food & Poverty
EXAMPLE-1
I am really inspired by the book L.a. now – interesting photo and graphic design.
Bartlett School of Architecture final show _ watch 2'-3'
Map/Territory Shows Augmented Reality of the Future
Map/Territory from timo on Vimeo.
HOW?
1 Mapping all the locations of main accommodation in Auckland Central
2 Collecting the information and data about the Auckland CBD demographics
3 Collecting the data about the rate of the accommodation occupancy in Auckland CBD
4 In the end, I am going to viualise the data and represent the mapping project


